
This week, I will be sharing some of my favorite websites with you that are exemplary online maps; both interactive and informative. These are ten maps that I find noteworthy in their creative design, intriguing spatial data, or the stories they tell. In no particular order….

The first map I want to share with you is “Earth”, a beautiful and interactive mapping program that shows you climate information directly from the satellites currently orbiting our planet. I find the design of this website to be great because you are able to change the projection, data, and even change the date and time at which you are looking at the world. The link below will take you to the platform, and I have chosen my favorite projection, the Waterman butterfly, showing the current surface wind strengths and directions. Click on the word ‘earth’ in the lower left corner to access the settings and change the data type: ocean waves, aurora present in both northern and southern hemispheres, and even chemicals and particulates.
https://earth.nullschool.net/#current/wind/surface/level/waterman=161.34,2.87,115
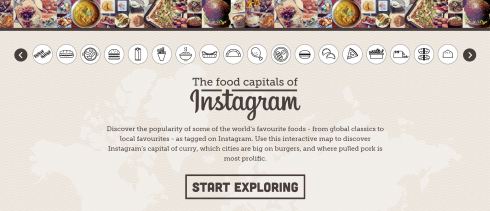
**Warning** The following map might make you hungry!! This interactive platform shows which cities have the highest Instagram tags for various types of food. While this map is definitely fun, I am skeptical of it because it does not say if the information is updated in real time or if it was taken from a specific moment of Instagram’s hashtag data. I also find this map intriguing because it reveals how the food experience is shared within different cities. While this might not be the most accurate map in the world, it sure is delicious.
https://cewe-photoworld.com/instagram-food-capitals/
Why go out into nature when you can google it:
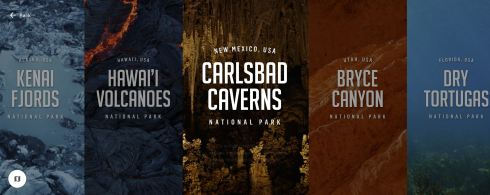
While I will always advocate for ACTUALLY going out in nature, the platform that Google Arts and Culture put together is a great interactive tour of our national park systems. The designers of this map used video and audio to create their map. Using aspects of google maps to help orient users to the place, and creating a visual experience as a map to our national parks. Using 360 degree photos and video, an interactive map experience is created. These programs are incredibly well shot and are great as a mini series. Great UX/UI.
https://artsandculture.withgoogle.com/en-us/
What the ship is going on in our oceans?
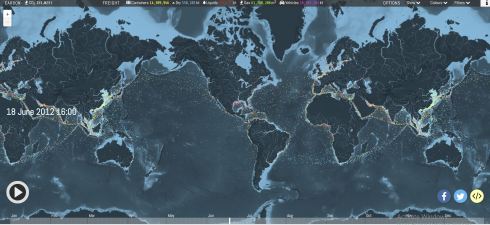
The ship map helps put global transportation into perspective. Using navigation data from 2012, this website will allow you to explore the high seas and see just how much our modern economy relies on shipping. The page opens with a video tour of the map, its legend, and key areas of shipping. The map shows no activity in the Northwest Passage, which is now becoming a more easily accessible and widely used route, due to sea ice melt in the summer. I also think that the map could have better zoom and pan interaction but otherwise it is a cool representation of global shipping.
shipmap.org
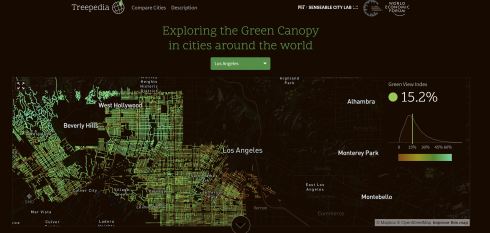
Treepedia is a mapping website that uses google street view to analyze the tree canopy in large cities around the world, or in other terms, the amount of green that you would see while walking down a street in said city…The map also gives a ‘Green index’ that compares the city you are looking at to other cities in the world. Downsides are that only large global cities are included and the program does not consider all green space, such as parks, only tree cover. Made by MIT, this site has fairly good design, however I think it would have been better if they considered using the normalized difference vegetation index (NDVI), which shows all vegetation.
http://senseable.mit.edu/treepedia/cities/los%20angeles
Where does YOUR president fly?

The following map in interactive infographic that has incredible design and layout allowing you to see all the president and secretary of state travels from 1905 to 2016. The map places DC at the center and uses a conic projection to fit the world into a sphere. The legend of the map, or data infographic is represented around the circumference of the map charting number of visits and the dates of which the visits took place. I am impressed with the coding behind this website, the design interface, and The Digital Scholarship Lab at Richmond University.
http://dsl.richmond.edu/panorama/executiveabroad/#
I made the map below using the National Geographic Map app!
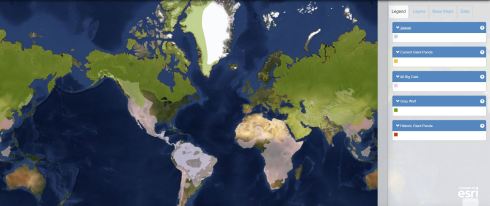
Showing the regions where the following animals reside/have resided.
National Geographic’s map maker program is a great introduction to the ESRI online mapping software. While you can’t import your own data like ESRI’s ArcGIS Online program, they have selection of curated data layers that you can choose from. Their interface is much easier to navigate than the full program.
https://mapmaker.nationalgeographic.org/
A murder mystery map / 2016 Rio Olympic EXPOSED
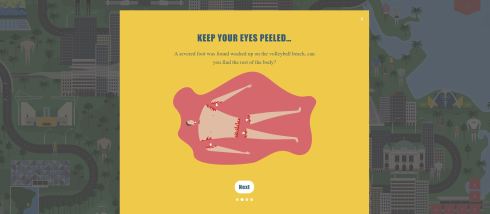
Ok, I am going to be honest with you all… this is not the most scientific map, it definitely has a bias to it, and was made by designers, not mapmakers, but nonetheless, it is fun and definitely interactive, and somewhat kind of not really to scale. Created by Fiasco Designs, a creative firm out of Bristol, England this interactive cartoon maps points out all the flaws of the 2016 Olympics. There is murder, corruption, zika, usain bolt… What more could you ask for in an infographic map?
http://rio2016interactivemap.com/

Those are the three words that will take you directly to Grace Ford Salvatori Hall. A brilliant company out of England split up the whole world into a three meter by three meter grid, assigning each square three words. In doing so, giving someone your address became more accurate and even a bit covert. I think it operates as an interesting localisation method but lacks the ability to change languages. Better than sending a long address that often only brings you to the destination, but with your three words, you can direct someone to a specific location, within three meters of you. I appreciate that it lets you set the basemap with various platforms such as Google Maps, MapBox, ESRI Maps, Open Street Map, and TOMTOM. What are your three words?
Is it a bird? Is it a plane? Oh, it’s definitely a plane…
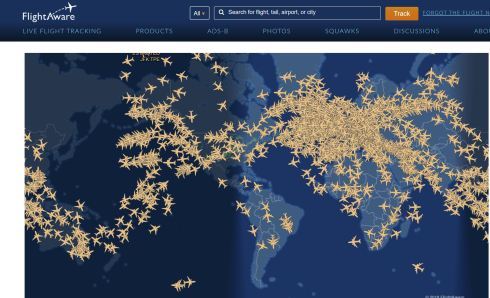
Have you ever looked up at a plane passing you by and wondered, where is that coming from or going to? Look no further, because flight aware lets you see all the registered planes in the sky, and where they are going. The application is great because it is constantly updated with real time information. I think that the phone app has a better user interface than the computer version, which happens sometimes when a map is designed for mobile instead of desktop web access. Love a good flight tracking app, especially if you’re running late!
Do you have any fun online maps you would like to share? Suggestions in the comments is greatly appreciated!

All of these maps are so fun! And displays how diverse maps can be, and how useful they can be for displaying information in a way that people understand relatively naturally. I love the flight tracker and Treepedia – having trees on a street tends to immediately make it feel fancier. I think I read once that this actually improves property value. Great post!
LikeLike
I’ve always thought of maps in conventional ways, but after reading your blog I realized how many different variations a map can have! The study and creation of maps have so much creative potential and especially because I’m taking a class on information visualization, it was inspiring to see all the different maps and specific purposes. 🙂
LikeLike